Bacterial Sources in the Gunpowder River

Memorial Day through Labor Day, Gunpowder RIVERKEEPER® conducts weekly bacterial water quality monitoring to inform river users of conditions that are more likely to result in bacterial infection. These conditions usually occur after periods of heavy rainfall as the stormwater runoff carries surface pollutants and discharges into the waterways. E. Coli is one of a …

Read more

Gunpowder River Water Quality Update: May 26, 2026

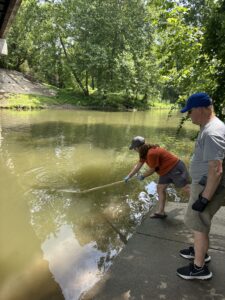
Gunpowder RIVERKEEPER® is proud to provide weekly water quality information to residents of Baltimore and Harford counties along the Gunpowder and Bush River Watersheds. Our water monitoring results help inform the public on where they can recreate safely along the River and provide indicators for possible stormwater or point-source pollution. The EPA’s Safe Swimming Criteria …

Read more

Update on Gunpowder RIVERKEEPER® pursuit for Tier III Water Quality Monitoring Approval

Since November 2025, Gunpowder RIVERKEEPER® has been working diligently alongside the Chesapeake Monitoring Cooperative (CMC) who provides technical and logistical support to partners, communities, and individuals who want to collect, share, interpret, and use water quality data to increase understanding of Chesapeake Bay watershed health. Gunpowder RIVERKEEPER® is currently in the process of obtaining its Tier III approval …

Read more

2026 Anadromous Fish Spawn Monitoring Round Up

Thanks to Maryland Department of Natural Resources (MDNR) Fish Biologists Jeffrey Horne, Marek Topolski, Marissa Ponte, and Shannon Moorhead and all of the volunteers who came out to help us collect samples and data to inform Fisheries’ study of the spawning habits of anadromous fish (those that swim upriver from saltwater to freshwater for the …

Read more

Chesapeake Water Watch Publishes 2025 Data Report

Gunpowder RIVERKEEPER® was pleased to receive our data report from Rae Terracina, the Chesapeake Water Watch Program Manager at Smithsonian Environmental Research Center. The data, reproduced below, show the percentage of samples for Chlorophyll-a and turbidity that fall over or under the EPA thresholds for those metrics. The report also includes a map showing the …

Read more